Jonatan Alexandre de Oliveira, José Giacomo Baccarin and Eduarda Pires Valente da Silva Costa | 19/08/2024
From the Journal of Agricultural & Food Industrial Organization
Download here the complete article “Food Inflation in Brazil in the Last Decade – Comparing Evolution Trends Before and During the COVID-19 Pandemic” in pdf format
Abstract
The objective is to characterize food inflation in general and, particularly, the food items and agrifood chains, according to the level of exposure to foreign trade, degree of processing, and inflation indicators in nine metropolitan areas of Brazil between 2007 and 2022. Basically, the data used were surveyed by the Brazilian Institute of Geography and Statistics for the Broad Consumer Price Index (Índice de Preços ao Consumidor Amplo, IPCA). The study fully characterized the food inflation in Brazil between 2007 and 2022, which was aggravated during the Covid-19 pandemic. Food-at-home inflation was generalized among its household components. Items associated with animal protein tended to put the most pressure on food-at-home prices. Among the agrifood chains, the lowest price variations were observed in products with greater exposure to foreign trade. A greater price variation was observed for fresh or minimally processed food products compared to more processed food products. Among the nine cities studied, from all regions of Brazil, no major differences were found in the variations of food prices of all groups considered.
1 Introduction
Food inflation is characterized when food becomes more expensive continuously or for an extended period compared to other prices practiced by the consumer. Between January 2007 and December 2022, the Broad Consumer Price Index (from the Portuguese, Índice de Preços ao Consumidor Amplo, known as IPCA), which is the official consumer inflation index in Brasil, increased by 126.0 %. In turn, the Food and Beverage Price Index (Índice de Preços de Alimentos e Bebidas, IPAB), one of the nine components of the IPCA, increased by 214.2, 88.1 % more than the broad IPCA (IBGE 2022a, 2022b, 2022c, 2022d). This study aims at investigating the manifestation and characteristics of food inflation in Brazil, starting in 2007.
In general, this increase in food prices and, consequently, food-at-home inflation, is believed to be caused by the internationalization of Brazilian agriculture in a period when food prices in the international market remained at historically high levels (Baccarin and Oliveira 2021; Hailu 2021). This price increase was accentuated during the Covid-19 pandemic (de Soyres et al. 2022; Rana et al. 2023). As indicated by the Food and Agriculture Organization of the United Nations (FAO) food price index grew by 73.8 % between May 2020 and March 2022, when it reached the highest value in the entire historical data series (FAO 2023).
Therefore, food inflation in Brazil continues or persists for more than 15 years, with known negative social impact, especially among the poorest, who use a larger portion of their income just to feed themselves. Due to the social and economic effects of the pandemic, inflation was aggravated during and after Covid-19, thus justifying choosing this event as a temporal divider in the analysis of inflation rates proposed here.
The inflationary impacts of Covid-19 have been discussed in works such as CEPAL/FAO (2020); Oxfam (2022); Schneider et al. (2020) and Zago (2021). At first, it was assumed that the negative effects of the pandemic, with reduced economic growth, increased unemployment, and a drop in purchasing power could contain food prices due to reduced demand. Over time, it was confirmed that many families reduced food consumption while food insecurity indices worsened. However, food prices did not reduce due to a few problems found in the world’s value chains and agricultural supply. The production cost of agricultural items, especially fertilizers, increased due to difficulties in maintaining the level of production and world exports, in addition to strong speculative movements that led the profit of transnational food companies to skyrocket.
This study aims at contributing to a better understanding of food-at-home inflation in Brazil, before and during the Covid-19 pandemic, more specifically, from 2007 to 2019 and from 2020 to 2022. Other works in the literature discuss consumer food inflation and the conditions of Brazilian agriculture, assuming that the latter is the cause of the greatest pressure on price increases, especially from at-home food, and not the other segments of the agrifood groups. In this regard, this study evaluates variables such as trade openness, production and domestic availability of agricultural products, degree of food processing, and the relationships among prices practiced by farmers, world trade, and consumers.
This work identifies and describes the characteristics of food-at-home inflation in Brazil, hoping to contribute to the understanding of the reasons for inflation. Specifically, the study seeks to (a) determine the weight of the various components in food inflation, according to IPCA surveys; (b) verify the impact of several agro-industrial food chains on the price increases, according to the degree of openness to foreign trade; (c) analyze the price variation of foods with different degrees of processing; (d) study regional manifestations of food inflation, testing its national character.
2 Literature Review
In recent years, many national statistical offices (NSOs) have experimented with using online data in official CPIs, including the US Bureau of Labor Statistics (Horrigan 2013), Statistics Netherlands (Griffioen, Ligtvoet, and Broek 2014), Statistics New Zealand (Krsinich 2015) and Statistics Norway (Nygaard 2015). Many NSOs have started to incorporate big date for their official statistics (United Nations Statistical Commission 2014). Such as the use of automatic web scraping of food prices from online stores. Web scraping gathers and copies data from the web, typically into a central local database or spreadsheet, for later retrieval or analysis (Hillen 2019a, 2019b). In this case, the term refers to automated processes implemented using an algorithm (bot) on supermakets websites (e-stores) (Hawkins et al. 1968).
Although we do not attempt to build a fully structural model of food prices, economic theory guides the selection of explanatory variables. At a fundamental level, food prices reflect equilibrium between supply and demand forces, and the model should therefore include the main shifters of supply and demand. On the supply side, a cursory analysis of the cost structure of the food industry indicates that, in addition to raw agricultural commodities, two other inputs are likely to have a major impact on retail food prices: labour, which is used in processing, wholesale, and retail; and energy, which is required for both the transformation of the raw commodities and the transportation of food to the final consumer (Irz, Niemi and Liu 2013). The state of the technology also influences the position of the industry supply curve, but the process of technological change is implicitly proxied by a time trend in the model (Hawkins et al. 1968).
On the other side of the equilibrium relationship, demand is influenced by the average and distribution of disposable income as well as changes in the demographic composition of the population, but the latter are unlikely to be very large in a homogenous country such as Finland with little population growth and limited immigration (Irz, Niemi and Liu 2013). Ultimately, the empirical model attempts to explain retail food prices by the unit costs of agricultural raw materials, energy, and labour, while income is ignored due to the unavailability of monthly data (see below).
In terms of costs, part come from imports (cost of importing petroleum products, fertilizers, and other finished products relating to agricultural commodities) (Samal et al. 2022).
Technological and preference changes are captured by trends in the model. The omission of income from the model, although unfortunate, is a feature shared with other analyses of food prices, such as Leibtag (2009) and Baek and Koo (2010).
Besides factors as labour, energy costs and technology development, there are other factors that interfere with production prices and inflation. International food prices have a strong relation with prices in the production but also as a result of pressure of commodity imports from other countries. Another factor is the price of transportation, that make pressure in the final price (Vavra and Goodwin 2005).
In this context, we assist to a growing internationalization of food markets, based on countries that are producers at lower prices (as south America and Asia), high exportations envolving important transportation costs, and final consumption prices in more developed countries that reflects this process. When prices paid to producers by the international market are high, producers tend to export, living less production for the internal market, what also make the price become higher (Conforti 2004).
Policies as imports tariffs and production subsidize, can also interfere with prices. And finally, two global factors, can be considered to have consequences in the prices. The first is related with climate change, that impacts in water availability and commodities production and the second one, is related to the COVID-19 pandemia, that impacted in the food production, processing, distribution, and demand (Rana et al. 2023; Serpil and Mehmet 2020). Also the Ukrania War, with large consequences in the production, due to prices of fuel and fertilizers, is a major concern for global poverty and food insecurity (Arndt et al. 2023).
Estimate price evolution and inflation trends becomes more important, specially in low economic countries, where consumers tend to spend a higher proportion of their income on food items (Headey 2018; Hailu 2021; Headey and Hirvonen 2022).
3 Methodology
Data on price variation and the participation of the various components in consumer inflation were taken from the Broad Consumer Price Index (IPCA) disclosure tables, surveyed by IBGE (Brazilian Institute of Geography and Statistics). The IPCA target population is urban families from different capitals or metropolitan areas of Brazil, with incomes ranging from 1 to 40 minimum wages (IBGE 2005).
IPCA goods and services are classified into four hierarchical levels: groups, subgroups, items, and subitems. Each is assigned a weighting coefficient calculated as the ratio between the value of their expenditure and the total consumer expenditure on all goods and services. Estimates of consumer spending are based on editions of the Family Budget Survey (Pesquisa de Orçamento Familiar, POF) also conducted by the IBGE. The IPCA from 2007 to 2011 was based on the POF 2002/03; from 2012 to 2019, on the POF 2008/09, whereas the IPCA after 2020 has been based on the POF 2017/18.
Nine expense groups were considered, including food and beverages, with two subgroups: food at home and food away from home. The first subgroup contains 16 items, which are the same in the three POFs, and approximately 160 subitems, which change according to the consumption pattern observed in the POFs. In turn, food away from home does not include items and, comprises nine sub-items as of 2020.
Most of the time, the weighted data of the national IPCA used expresses the average change in prices of several metropolitan areas from all Brazilian regions. The price variation and the contribution of the components (subgroups, items, and subitems) to the inflation of the food and beverages group or the food-at-home subgroup were studied. The contribution of the different components was calculated considering the relative importance of each item in the weighting structure of IPCA expenses.
Based on the subitems of the food-at-home subgroup, two other classifications were made. The first relates the subitems to their agricultural origin, seeking to establish the contribution of agro-industrial groups to food inflation. The data allowed us to determine 23 agroindustrial food chains or product groups, until 2019, and 24, after 2020. For 19 of them, with a well-defined and specific agricultural origin, the level of trade openness was calculated, based on export and import data, available in the AgroStat System of the Ministry of Agriculture, Livestock and Food Supply (BRASIL 2023), and national production, obtained from several IBGE publications.
Furthermore, based on Monteiro et al. (2018), the subitems were classified according to the degree of processing and purpose into four groups as follows: G1 – in natura/minimally processed foods, G2 – processed culinary ingredients, G3 – processed foods, and G4 – ultra-processed foods.
Finally, with a methodological adaptation, the specific manifestation of food inflation was analyzed in nine cities where the IBGE survey is conducted. G1 was subdivided into two subgroups, in natura and minimally processed products, assuming that the first could present greater price variations among the studied cities due to long-distance transport difficulties.
4 Results and Discussion
4.1 Food Inflation: The Broad Consumer Price Index (IPCA) Components
Studies by Mendonça de Barros, Rizzieri, and Picchetti (2001), Farina and Nunes (2002), and Castro and Magalhães (2006) report a reduction in real food prices in Brazil between 1975 and 2002. Farina and Nunes (2002) calculated a 20 % real drop in food prices in general and 15 % in food away from home, between August 1994 and February 2002. These authors concluded that productivity gains and decreasing profit margins in the food industry and food distribution (especially, in supermarkets) were responsible for the drop in food prices in Brazil compared to developments in agriculture.
This trend observed was in line with the evolution of international food prices. FAO studies show that real food prices dropped close to 50 % in the world in the last four decades of the 20th century. However, unlike the conclusion by Farina and Nunes (2002), FAO concludes that agriculture, in particular, the technological advances associated with the Green Revolution resulted in the decreasing average cost of agricultural production while allowing production to increase even as the prices were falling. The supply of agricultural products and food was also positively impacted by strong agricultural protectionism, linked to production incentives, in developed countries, especially in Europe and the USA (FAO 2005).
Data from the first six years of the XXI century shows that the drop in food prices in Brazil tended to continue, and the IPAB was lower than the IPCA, although not as significant (Baccarin and Oliveira 2021). However, after 2007, Figure 1 shows a reversal of the trend, and the IPAB was lower than the IPCA only in 2009, 2017 and 2021. Between 2007 and 2019, the IPCA varied by 103.5 % and the IPAB by 155.7 %, with annual averages of 5.6 and 8.0 %, respectively. During the pandemic, the IPCA varied by 21.7 % and the IPAB by 37.5 % with respective annual averages of 7.2 and 12.5 %, almost double that of the previous period.

In 2020, the IPAB was more than three times the IPCA. In 2021, although still high, the IPAB dropped to close to 8 %, while the IPCA reached just over 10 %, indicating that other components, in addition to food, pushed consumer inflation upwards. In 2022, the IPAB registered the third value of the entire series, once again surpassing the IPCA.
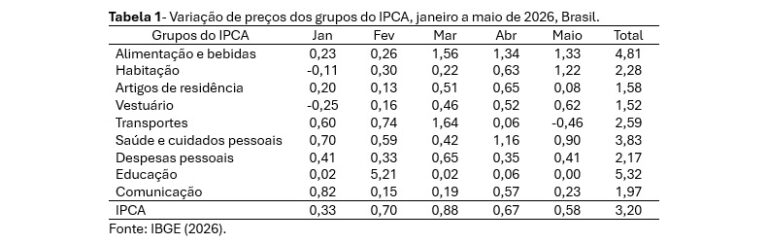
Table 1 shows that before the pandemic, the food-away-from-home (IPAF) subgroup varied more than the food-at-home (IPAD) subgroup. This result can be correlated with the increase in the average income of Brazilians, at least until 2014, and with the rising prices of urban services such as bars, snack bars, and restaurants (Baccarin and Oliveira 2021). However, food-at-home prices also increased above the IPCA, indicating that other segments of the agrifood groups, such as agriculture, put upward pressure on food prices.

During the pandemic, prices behaved differently and the IPAD value was more than double the IPAF in the period. Restrictions on people’s mobility for sanitary reasons led to a sharp drop in consumption in commercial businesses specialized in providing meals, which was not fully offset by the growth in delivery services.
On the demand side, the greater allocation of consumer spending to food at home, to the detriment of spending on food away from home, leisure, transport, clothing, etc., offset, at least partially, the dropping average labor income. Also, the emergency aid granted to millions of Brazilian families by the Federal Government added pressure to food prices, especially in the second half of 2020. As a result, the real sales index measured by the Association Brasileira de Supermercados increased by 9.4 % in 2020 compared to 2019, the highest annual value since 2001 (ABRAS 2021). It is noteworthy that 75 % of supermarket sales are food.
Table 2 shows the 16 items of the food-at-home subgroup and those that contributed the most to food inflation. The item contribution was calculated based on weighting the price variation by the item’s percentage share in the food-at-home subgroup. Only the items, oils and fats, and canned and preserved products increased below the IPCA of 103.5 % measured in the period.

Meat prices, largely beef, included in the minimally processed subgroup varied the most, close to 90 %, between 2007 and 2019. Three other items, vegetables and greens; tubers, roots and legumes; and fruits, marketed in natura, also had very high price variations.
In this period, meat contributed the most to inflation (26.8 %) due to increasing prices and the large participation (∼15 %) in food-at-home expenses. Three items, meat, baked goods, and milk and dairy products were responsible for almost 50 % of the price increase in the food-at-home subgroup. The last two items are not so much due to price variation, but because of their significant share in consumer spending, close to 13 % in this subgroup.

During the pandemic, Table 3 shows that only one i.e. fish, varied less than the IPCA value of 21.7 %. The biggest price increase, of 115.6 %, was recorded for tubers, roots and legumes. The second largest price increase during the pandemic, of 88.4 %, was seen in oils and fats, largely due to the increase in the price of soy oil. According to FAO (2023), the international price of vegetable oil (including soybeans and its products) increased by 2.5 times, between 2015 and May 2022, well above the other items considered: sugar, meat, cereals, and dairy products.
According to Table 3, as in the previous period, meat is still first but contributed less since meat prices varied less compared to the other items. Four items were responsible for almost half of food-at-home inflation, three of which are animal protein sources, which probably contributed to the decreasing nutritional quality of the diet of the poorest.
The prices of most items increased above the IPCA, thus allowing us to conclude that food inflation had a wide scope and cause. However, price variation at different intensities is observed between items and over time, suggesting that more specific issues also contributed to inflation. In this sense, it is suggested to approach the characteristics of agrifood chains, such as the level of concentration of their segments (which will not be developed here), the degree of food processing, and the importance of foreign trade.
4.2 The Importance of Agricultural Chains in Food Inflation
In the 2007–19 period, beef contributed the most, about 30 %, to the increase in prices of food at home (Table 4). This is the second most important chain in consumer spending and had a price increase of 281.2 %, well above the average inflation of 156.3 % for the other chains. Along with wheat and dairy cattle, these three chains accounted for more than half of food-at-home inflation.

In addition to beef cattle, price increases of over 200 % were observed in five other chains: laying poultry, potatoes, oranges and citrus, onions and manioc. However, their contributions to raising prices were relatively modest due to their small share in consumer spending.
Table 5 shows the results for the period 2020 to 2022. Two initial observations are necessary since as of 2020, the IPCA structure has changed based on the POF 2017/18, thus also changing the share of the chains in the food-at-home subgroup (compared to the data in Table 4) while one more chain was incorporated, other animals.

The soy complex had the second biggest price increase of 101.3 %, well above the average price increase of 56.3 % observed for the other chains, contributing with a 4.5 % increase to the inflation of food at home, two times higher than its share in consumer spending.
Further, dairy products and beef and wheat contributed the most to the IPAD, although with a different order of importance and with a less significant joint weight than in the previous period. This result is due to very strong price increases in other chains, such as the soy complex, coffee, sugar and alcohol complex, potatoes, onions and tomatoes.
Additionally, an exercise on the variation of consumer prices for 18 chains with different participations in international trade was conducted exclusively for the 2007–19 period. A study by IPEA (2011) pointed out that from 2007 to May 2011, two food groups pushed inflation upwards, the away-from-home and food chains that participate strongly in foreign trade (known as tradable goods), while the foods of the nontradable goods pulled it down, although with much more intense annual price fluctuations.
This section deals only with food at home and the respective chains/groups that were classified as (i) tradable, those groups/items whose exported or imported quantities exceed 10 % of the national production; (ii) intermediate tradable, imported and exported market shares between 3 and 10 % and; (iii) nontradable goods, shares below 3 %.
Unlike the IPEA (2011) study, Table 6 shows that the average increase in consumer prices was higher for nontradable and intermediate for moderately tradable, while the lowest increase was observed, precisely, for those products that participate strongly in foreign trade. It is noteworthy that the international prices of agricultural commodities were at historically high levels while the internal price increases of the three groups were above the IPCA between 2007 and 2019.

These results do not detract from the understanding that the internationalization of Brazilian agriculture, in a period of high international prices, has pressured domestic prices upwards. Most likely, the import or/and export prices affected directly the domestic price of tradable goods and indirectly the nontradable ones.
Furthermore, the various agricultural activities compete for land, investments and farmers’ expenses, so it is safe to assume that an increase/decrease in international prices may end up affecting negatively/positively the cultivated area and production of nontradable goods. Concerning the market demand, Maluf and Speranza (2013) suggest that the increasing prices of tradable goods may lead to a price increase of nontradable goods and, subsequently, of production of nontradable goods that may substitute the first, such as among the different sources of carbohydrates, rice, potatoes, cassava and wheat. Or between animal proteins, such as beef and chicken eggs.
4.3 Inflation According to the Degree of Food Processing
Table 7 shows that according to the degree of processing, fresh or minimally processed foods (G1) had a greater contribution to the IPAD compared to its share in consumer spending, in both periods. On the other hand, the opposite behavior was observed for processed and ultra-processed products, so G3 and G4 groups put less pressure on prices. Culinary ingredients, G2, at first, behaved similarly to G3 and G4 but, during the pandemic, their participation in the IPAD was much greater than that of food-at-home spending. This result is explained by the great price increase of foods derived from soy and sugarcane, which represent more than 90 % of the G2.

The data show that foods from G1, with a lower degree of processing, put the most pressure on food inflation in the analyzed period. Partially, because less processed food has a large share in the consumption structure, but also because the prices have risen above other groups. Indirectly, this could be interpreted as an indication that agricultural prices played a decisive role in raising food prices, more than those of industrial processing or retail distribution. Further, the weight of agricultural products in the cost and price of food tends to be greater in less processed foods.
In nutritional terms, in a first approximation, it can be said that products with higher nutritional quality, precisely in natura or minimally processed items, were relatively more expensive than those with lower nutritional quality, especially the ultra-processed ones, what have large impacts in low-income families.
Another important finding is that between 2008–09 and 2017–18, while G1 increased its share of food-at-home spending and G4 decreased, the opposite occurred regarding the intake of calories. The calorie intake share of G1 reduced from 50.4 to 49.5 % whereas G4 increased from 16.0 to 18.4 % (IBGE 2020). Not discarding other factors, the data allows us to conclude that the relatively higher price increase of G1 played an important role in the more intense use of products with lower nutritional quality in the average diet of the Brazilian population.
4.4 Regional Manifestation of Food Inflation
The objective is to check for value dispersion of the inflation components among the cities where the IBGE conducts price surveys. Data collected from 2007 to 2022 from nine cities, Belém, Fortaleza, Recife, Salvador, Belo Horizonte, Rio de Janeiro, São Paulo, Curitiba and Porto Alegre were used. The subitems were grouped according to the degree of processing and G1 was divided into G1.1, consisting of products in natura, and G1.2, the minimally processed ones, in which meat and dairy products predominate.
Figure 2 shows that the hierarchy of price variation of product groups is practically the same in all cities. With few exceptions, the greatest variation was registered in G1.1, followed by G1.2, G2, G3 and G4, basically from the lowest to the highest degree of processing.

Table 8 shows basic statistics on price changes in the nine cities. The greatest average variation occurred in G1.1, fresh products, and the smallest in ultra-processed products, G4. All coefficients of variation were below 21 %, a value considered low (GOMES 1985) and indicating that there was no great dispersion in price variation between cities for each product group.

The highest standard deviation and the second highest coefficient of variation were observed in G1.1, which appears to be associated with the nature of the group products. Because the long-distance transport of products in natura is more difficult, production tends to be developed around the cities where the study was conducted, thus leading to different cost and price conditions.
The low coefficients of variation registered in G1.2, G3 and G4 are not surprising, given the oligopolistic and national character of their companies, such as meatpacking plants, dairies and large companies that produce processed and ultra-processed products. However, for G2, predominantly sugar and soy oil, the coefficient of variation was the highest, which was not expected since few companies sell directly to consumers in this group as well.
5 Conclusions
The food inflation in Brazil was fully characterized between 2007 and 2022. The surveyed data show that the Food and Beverage Price Index (IPAB) was lower than the Broad Consumer Price Index (IPCA) in only three years. This result worsened from 2020 onwards, during the Covid-19 pandemic.
Regarding subgroups, compared to food away from home, the food at home increased less between 2007 and 2019 and more sharply from 2020 to 2022, apparently associated with changes in consumer habits during the Covid-19 epidemic.
In Brazil, food-at-home inflation was generalized among household items over the studied period. Most of the items recorded price increases above the IPCA due to the large share in the consumer spending structure as is the case of meat (predominantly beef). Between 2007 and 2019, the sharp rise in prices of items associated with animal proteins tended to put the most pressure on the prices of items in the food-at-home subgroup.
Among the agrifood chains, the tradable goods with greater exposure to foreign trade had lower price variation, intermediate tradable with average exposure had average variation, and nontradable goods with little exposure to foreign trade exhibited broader price variation. International food prices remained at relatively high levels in the period, directly affecting domestic prices of tradable goods. Furthermore, the prices of nontradable goods were indirectly affected since they compete with the tradable goods for planting areas, investments, and farmers’ expenses as well.
As for the degree of food processing, a greater price variation was recorded for fresh or minimally processed products compared to more processed products. This result ended up affecting consumer habits by decreasing consumption of the former and increasing the latter, appearing to reduce the nutritional quality of food consumed at home.
Among the considered nine metropolitan areas from all regions of Brazil, food prices did not vary significantly for the studied groups. In conclusion, compared to more processed foods whose production is concentrated in a small number of large companies, products in natura had greater price variations between cities and more dispersed production due to the greater difficulties faced when transporting fresh foods over long distances.
Corresponding author: Jonatan Alexandre de Oliveira, Department of Economics, São Paulo State University “Júlio de Mesquita Filho” (UNESP), São Paulo, Brazil, E-mail: [email protected]
References
Abras. Associação Brasileira de Supermercados. 2020. Índice de vendas do mês de dezembro de 2020. São Paulo. https://www.abras.com.br/economia-e-pesquisa/indice-de-vendas/indice-do-mes/ (accessed March, 2021).Search in Google Scholar
Arndt, C., X. Diao, P. Dorosh, K. Pauw, and J. Thurlow. 2023. “The Ukraine War and Rising Commodity Prices: Implications for Developing Countries.” Global Food Security 36: 100680. https://doi.org/10.1016/j.gfs.2023.100680.Search in Google Scholar
Baccarin, J. G., and J. A. de Oliveira. 2021. “Inflação de Alimentos no Brasil em período da Pandemia da Covid 19, continuidade e mudanças.” Segurança Alimentar e Nutricional 28: 8661127. https://doi.org/10.20396/san.v28i00.8661127.Search in Google Scholar
Baek, J., and W. W. Koo. 2010. “An Analysis of the Impact of Ethanol Production on U.S. and Regional Gasoline Markets.” Energy Policy 38 (8): 4390–9.Search in Google Scholar
BRASIL. Ministério da Agricultura, Pecuária e Abastecimento (MAPA). 2023. Estatísticas de comércio exterior, Sistema AgroStat. http://www.agricultura.gov.br/assuntos/relacoes-internacionais/estatísticas-de-comercio-exterior (accessed February, 2023).Search in Google Scholar
Castro, P. F., and L. C. G. de. Magalhães. 2006. Gasto e consumo das famílias brasileiras contemporâneas, Vol. 1, edited by F. G. Silveira, L. M. S. Servo, T. A. de Menezes, and S. F. Piola, 21–69. Brasília, Brazil: IPEA.Search in Google Scholar
CEPAL/FAO. Comissão Econômica para América Latina e Caribe, Organização das Nações Unidas para Agricultura e Alimentação. 2020. Cómo evitar que la crisis del COVID-19 se transforme en una crisis alimentaria – Acciones urgentes contra el hambre en América Latina y el Caribe. Informe COVID 19. CEPAL/FAO.Search in Google Scholar
Conforti, P. 2004. “Price Transmission in Selected Agricultural Markets.” FAO Commodity and Trade Policy Research Working Paper, No. 7.Search in Google Scholar
de Soyres, F., A. M. Santacreu, and H. Young. 2022. Fiscal Policy and Excess Inflation during Covid-19: A Cross-Country View, FEDS Notes. Washington: Board of Governors of the Federal Reserve System.10.17016/2380-7172.3083Search in Google Scholar
Farina, E. M. M. Q., and R. Nunes. 2002. A evolução do sistema agroalimentar e a redução de preços para o consumidor: o efeito de atuação dos grandes compradores. São Paulo: PENSA.Search in Google Scholar
FAO. Organização das Nações Unidas para Agricultura e Alimentação. 2005. El estado de los mercados de productos básicos agrícolas. Roma: FAO.Search in Google Scholar
FAO (Organização das Nações Unidas para e Agricultura e Alimentação). 2023. Índice de precios de los alimentos de la FAO [Internet]. https://www.fao.org/worldfoodsituation/foodpricesindex/en/ [citado em abril 18, 2023].Search in Google Scholar
Gomes, F. P. 1985. Curso de estatística experimental. São Paulo: Nobel.Search in Google Scholar
Griffioen, A., A. Ligtvoet, and J. v. d. Broek. 2014. Online data and the Dutch consumer price index. Amsterdam, Netherlands: Statistics Netherlands.Search in Google Scholar
Hawkins, M. H., A. A. Warrack, and W. S. Pattison. 1968. “Intracity Retail Food Price Behavior and the Impact of Price Enquiries*.” Canadian Journal of Agricultural Economics/Revue Canadienne D’agroeconomie 16 (3): 131–41. https://doi.org/10.1111/j.1744-7976.1968.tb02458.Search in Google Scholar
Hailu, G. 2021. “COVID-19 and Food Processing in Canada.” Canadian Journal of Agricultural Economics 11. https://doi.org/10.1111/cjag.12286.Search in Google Scholar
Headey, D. 2018. Food Prices and Poverty. The World Bank Economic Review 32, 676–91.10.1596/33532Search in Google Scholar
Headey, D. D., and K. Hirvonen. 2022. Food Inflation, Poverty, and Urbanization (IFPRI Discussion Paper No. 2134). The International Food Policy Research Institute.10.2499/p15738coll2.136356Search in Google Scholar
Hillen, J. 2019a. “Web Scraping for Food Price Research.” British Food Journal 121 (12): 3350–61, https://doi.org/10.1108/BFJ-02-2019-0081.Search in Google Scholar
Hillen, W. 2019b. “Web scraping for official statistics: Techniques and applications.” Journal of Statistical Research, 121 (12): 3350–61.10.1108/BFJ-02-2019-0081Search in Google Scholar
Horrigan, M. W. 2013. “Big Data: A Perspective from the BLS.” Amstat News 25–27.Search in Google Scholar
IBGE. Instituto Brasileiro de Geografia e Estatística. 2020. Pesquisa de Orçamentos Familiares 2017–18 – Avaliação nutricional da disponibilidade domiciliar de alimentos no Brasil. Rio de Janeiro: IBGE. https://biblioteca.ibge.gov.br/visualizacao/livros/liv101704.pdf (accessed April, 2022).Search in Google Scholar
IBGE. Instituto Brasileiro de Geografia e Estatística. 2022a. Produção Agrícola Municipal. https://www.ibge.gov.br/estatisticas/economicas/agricultura-e-pecuaria/9117-producao-agricola-municipal-culturas-temporarias-e-permanentes.html?=&t=downloads (accessed April, 2022).Search in Google Scholar
IBGE. Instituto Brasileiro de Geografia e Estatística. 2022b. Pesquisa trimestral Do abate de animais. https://www.ibge.gov.br/estatisticas/economicas/agricultura-e-pecuaria/9203-pesquisas-trimestrais-do-abate-de-animais.html?=&t=downloads (accessed April, 2022).Search in Google Scholar
IBGE. Instituto Brasileiro de Geografia e Estatística. 2022c. Produção de ovos de galinha. https://www.ibge.gov.br/estatisticas/economicas/agricultura-e-pecuaria/9216-pesquisa-trimestral-da-producao-de-ovos-de-galinha.html?=&t=downloads (accessed April, 2022).Search in Google Scholar
IBGE. Instituto Brasileiro de Geografia e Estatística. 2022d. Pesquisa Trimestral Do Leite. https://www.ibge.gov.br/estatisticas/economicas/agricultura-e-pecuaria/9209-pesquisa-trimestral-do-leite.html?=&t=downloads (accessed April, 2022).Search in Google Scholar
IBGE. Instituto Brasileiro de Geografia e Estatística. 2023. Índice de preços ao consumidor amplo. https://sidra.ibge.gov.br/home/ipca/brasil (accessed July, 2023).Search in Google Scholar
IBGE. Instituto Brasileiro de Geografia e Estatística. 2005. Sistema Nacional de Índices de Preços ao Consumidor: estruturas de ponderação a partir da Pesquisa de Orçamentos Familiares 2002–2003. Rio de Janeiro; 2005. https://biblioteca.ibge.gov.br/index.php/biblioteca-catalogo?view=detalhes&id=282203 (accessed February, 2020).Search in Google Scholar
Irz, X., J. Niemi, and X. Liu. 2013. “Determinants of Food Price Inflation in Finland—The Role of Energy.” Energy Policy 63: 656–63. https://doi.org/10.1016/j.enpol.2013.09.023.Search in Google Scholar
IPEA. Instituto de Pesquisa Econômica Aplicada. 2011. A dinâmica da inflação brasileira: considerações a partir da desagregação Do IPCA. http://repositorio.ipea.gov.br/handle/11058/3549 (accessed March, 2022).Search in Google Scholar
Krsinich, F. 2015. “The Use of Online Data in Consumer Price Indexes.” New Zealand Experience. Wellington, New Zealand: Statistics New Zealand.Search in Google Scholar
Leibtag, Ephraim S. 2009. The Impact of Big-BOX Stores on Retail Food Prices and the Consumer Price Index. Economic Research Report No. 33. United States Department of Agriculture. Berlin, Germany: Economic Research Service.Search in Google Scholar
Maluf, R. S., and J. Speranza. 2013. Volatilidade dos preços internacionais e inflação de alimentos no Brasil: fatores determinantes e repercussões na segurança alimentar e nutricional. http://bibliotecadigital.economia.gov.br/handle/123456789/170. (accessed February, 2022).Search in Google Scholar
Mendonça de Barros, J. R., J. A. B. Rizzieri, and P. Picchetti. 2001. “Os efeitos da pesquisa agrícola para o consumidor.” In Relatório de Pesquisa. São Paulo: Fundação Instituto de Pesquisas Econômicas.Search in Google Scholar
Monteiro, C. A., G. Cannon, J. C. Moubarac, R. B. Levy, M. L. C. Louzada, and P. C. Jaime. 2018. “The Un Decade of Nutrition, the NOVA Food Classification and the Trouble with Ultra-processing.” Public Health Nutrition 21: 5–17. https://doi.org/10.1017/s1368980017000234.Search in Google Scholar
Nygaard, S. 2015. Incorporating Online Data in Consumer Price Indexes: Norway’s Approach. Oslo, Norway: Statistics Norway.Search in Google Scholar
Oxfam International. 2022. The Global Food Crisis: The Impact of COVID-19 and the Need for Urgent Action. Oxford, United Kingdom: Oxfam International.Search in Google Scholar
Rana, Md. M., N. Roschnik, O. Taiwo, A. Kulemba, D. Dambuleni, and B. Phiri. 2023. “The Trends and Effects of Food Price Inflation on the Cost and Affordability of Nutritionally Adequate Diets in Malawi.” World Nutrition 3–13. https://doi.org/10.26596/wn.20231433-13.Search in Google Scholar
Samal, A., M. Ummalla, and P. Goyari. 2022. “The Impact of Macroeconomic Factors on Food Price Inflation: an Evidence from India.” Future Business Journal 8: 15. https://doi.org/10.1186/s43093-022-00127-7.Search in Google Scholar
Schneider, S., A. Cassol, A. Leonardi, and M. M Marinho. 2020. “Os efeitos da pandemia da Covid-19 sobre o agronegócio e a alimentação.” Estudos Avançados 34: 167–89. https://doi.org/10.1590/s0103-4014.2020.34100.011.Search in Google Scholar
Serpil, A., and S. A. Mehmet. 2020. “Impact of COVID-19 on the Food Supply Chain.” Food Quality and Safety 4 (4): 167–80. https://doi.org/10.1093/fqsafe/fyaa024.Search in Google Scholar
United Nations Statistical Commission. 2014. Big Data in Official Statistics: The Use of Big Data in National Statistical Offices. New York, United States of America: United Nations.Search in Google Scholar
Vavra, P., and B. K. Goodwin. 2005. Analysis of Price Transmission Along the Food Chain, OECD Food, Agriculture and Fisheries Working Papers, Vol. 3. OECD Publishing.Search in Google Scholar
Zago, A. 2021. “Food Inflation and Supply Chain Disruptions during the COVID-19 Pandemic.” Food Policy Review 45: 1–15, https://doi.org/10.1016/j.foodpol.2021.102123.Search in Google Scholar
Received: 2024-05-29
Accepted: 2024-07-01
Published Online: 2024-08-19
© 2024 Walter de Gruyter GmbH, Berlin/Boston
de Oliveira, Jonatan Alexandre, Baccarin, José Giacomo and Costa, Eduarda Pires Valente Da Silva. “Food Inflation in Brazil in the Last Decade – Comparing Evolution Trends Before and During the COVID-19 Pandemic” Journal of Agricultural & Food Industrial Organization, 2024. https://doi.org/10.1515/jafio-2024-0027